7 Database Performance Analyzer Tools for SQL Monitoring and Optimization
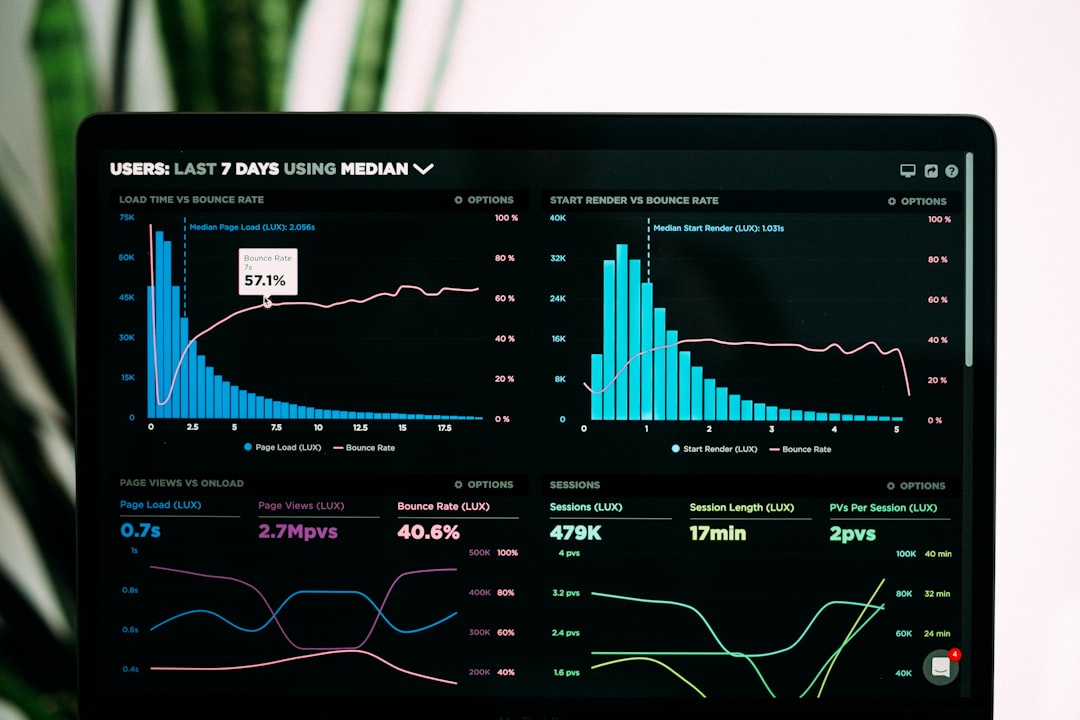
Slow SQL queries rarely fail all at once; they usually create small delays that accumulate into poor user experience, higher infrastructure costs, and operational risk. A serious database performance analyzer helps teams move beyond guesswork by showing which queries, waits, locks, plans, and resource patterns are responsible for latency.
TLDR: The best SQL monitoring and optimization tools combine query-level visibility, wait analysis, alerting, and historical baselines. For example, a SaaS team handling 2 million queries per day might discover that 6% of queries consume 70% of database CPU, making indexing and plan tuning far more targeted. Tools such as SolarWinds DPA, Redgate SQL Monitor, Datadog, New Relic, SQL Sentry, ManageEngine Applications Manager, and Percona Monitoring and Management are strong options depending on database type, team size, and budget.
Why SQL Performance Monitoring Matters
Modern applications depend on databases that must respond consistently under changing workloads. Even well-designed systems can degrade because of missing indexes, inefficient joins, blocking sessions, parameter sniffing, outdated statistics, or unexpected growth in data volume. A database performance analyzer provides the evidence needed to identify whether the bottleneck is in the query, schema design, server configuration, storage layer, or application behavior.
Good monitoring software should not only display CPU and memory charts. It should help answer practical questions: Which SQL statement slowed down after yesterday’s deployment? Which query is generating the most I/O? Which process is blocking others? Has the execution plan changed? The following tools are trusted options for SQL monitoring and optimization.
1. SolarWinds Database Performance Analyzer
SolarWinds Database Performance Analyzer, often referred to as SolarWinds DPA, is widely used for deep database performance monitoring across platforms such as SQL Server, Oracle, MySQL, PostgreSQL, and others. Its strength is wait-time analysis, which helps teams understand what queries are waiting on and why.
- Best for: Enterprises needing detailed root-cause analysis.
- Key features: Wait analysis, query tuning advice, blocking detection, historical trend reporting.
- Optimization value: Helps teams distinguish between CPU pressure, disk I/O, locking, and inefficient SQL.
SolarWinds DPA is especially useful when performance issues are intermittent. Instead of relying only on real-time snapshots, teams can review historical behavior and compare current performance against baselines.
2. Redgate SQL Monitor
Redgate SQL Monitor is a strong choice for Microsoft SQL Server environments. It offers a clean interface, practical alerting, and useful diagnostics for database administrators who need to monitor production systems with confidence.
- Best for: SQL Server teams that want clarity and fast incident response.
- Key features: Server health monitoring, query tracking, deadlock analysis, alert customization, estate overview.
- Optimization value: Highlights expensive queries, blocking chains, and changes that affect performance.
One of Redgate SQL Monitor’s advantages is its focus. It is not trying to monitor every technology in the stack; it is built to make SQL Server administration easier and more reliable. For companies heavily invested in Microsoft data platforms, that specialization can be valuable.
3. Datadog Database Monitoring
Datadog Database Monitoring fits organizations that want database performance visibility alongside application, infrastructure, container, and cloud metrics. It supports popular databases such as PostgreSQL, MySQL, SQL Server, and others, depending on the deployment model.
- Best for: DevOps teams working in cloud-native or distributed environments.
- Key features: Query samples, explain plans, database health metrics, anomaly detection, service correlation.
- Optimization value: Connects slow queries to application traces, hosts, services, and deployment events.
Datadog is particularly useful when database latency is only one part of a larger performance issue. If a checkout service slows down after a new release, teams can correlate database query time with application traces and infrastructure metrics in one place.

4. New Relic Database Monitoring
New Relic provides database monitoring as part of its broader observability platform. It is commonly used by engineering teams that already rely on application performance monitoring and want to connect SQL performance to real user experience.
- Best for: Application teams that need database visibility inside full-stack observability.
- Key features: Slow query analysis, transaction tracing, error correlation, dashboards, alert policies.
- Optimization value: Shows how database calls affect specific application transactions.
The benefit of New Relic is context. A database query may be slow, but the more important question is whether it affects critical workflows such as login, billing, reporting, or search. New Relic helps prioritize tuning work based on application impact.
5. SQL Sentry
SQL Sentry, now part of the SolarWinds portfolio, is another respected tool for SQL Server monitoring and tuning. It is known for rich visualizations, performance baselines, and deep SQL Server diagnostics.
- Best for: SQL Server DBAs managing demanding or business-critical workloads.
- Key features: Performance dashboards, blocking and deadlock analysis, query plan insight, tempdb monitoring.
- Optimization value: Helps uncover wait patterns, long-running queries, and resource contention.
SQL Sentry is suitable for teams that need a highly detailed view of SQL Server behavior. It can be especially effective in environments where performance tuning is an ongoing responsibility rather than an occasional task.
6. ManageEngine Applications Manager
ManageEngine Applications Manager offers database monitoring as part of a wider application and infrastructure monitoring platform. It supports multiple databases, including SQL Server, Oracle, MySQL, PostgreSQL, DB2, and others.
- Best for: IT operations teams that want broad monitoring coverage.
- Key features: Availability tracking, query statistics, resource usage metrics, alerts, capacity planning.
- Optimization value: Provides a practical overview of database health across mixed environments.
This tool may appeal to organizations that do not want separate monitoring systems for every technology layer. While it may not always provide the same depth as a specialized database tuning product, it offers strong operational visibility and centralized alerting.
7. Percona Monitoring and Management
Percona Monitoring and Management, commonly called PMM, is an open-source database monitoring platform with strong support for MySQL, PostgreSQL, and MongoDB. For SQL workloads in open-source database environments, it is a serious option.
- Best for: Teams using MySQL or PostgreSQL that want open-source monitoring.
- Key features: Query analytics, metrics dashboards, replication monitoring, performance trends.
- Optimization value: Identifies top queries by latency, load, and frequency, helping teams tune high-impact SQL.
PMM is useful for organizations that want transparency and flexibility. It can require more setup and database expertise than some commercial tools, but it provides strong analytical value without the same licensing structure as many enterprise platforms.
How to Choose the Right Tool
The best database performance analyzer depends on your technical environment and operational priorities. A SQL Server-focused DBA team may prefer Redgate SQL Monitor or SQL Sentry. A cloud-native engineering team may benefit more from Datadog or New Relic. Organizations running mixed database platforms may consider SolarWinds DPA or ManageEngine Applications Manager, while MySQL and PostgreSQL teams may find Percona Monitoring and Management compelling.
Before choosing, evaluate these criteria:
- Database compatibility: Confirm support for your exact database engines and versions.
- Query-level insight: Ensure the tool identifies expensive SQL statements and execution plans.
- Historical analysis: Look for baselines, trends, and before-and-after comparisons.
- Alert quality: Prefer alerts that reduce noise and point to likely causes.
- Integration: Consider how well the tool fits with incident management, DevOps, and observability workflows.
- Total cost: Review licensing, infrastructure, setup time, and administrative overhead.
Final Thoughts
Database performance optimization is most effective when it is based on evidence rather than assumptions. The right tool can reveal whether a problem comes from inefficient SQL, indexing gaps, locking, server pressure, or application behavior. More importantly, it helps teams prioritize the fixes that will deliver measurable improvement.
For serious SQL monitoring, choose a platform that matches your database stack, provides clear query-level diagnostics, and supports both real-time troubleshooting and long-term optimization. When used consistently, these tools can reduce incident duration, improve application response times, and make database operations more predictable.