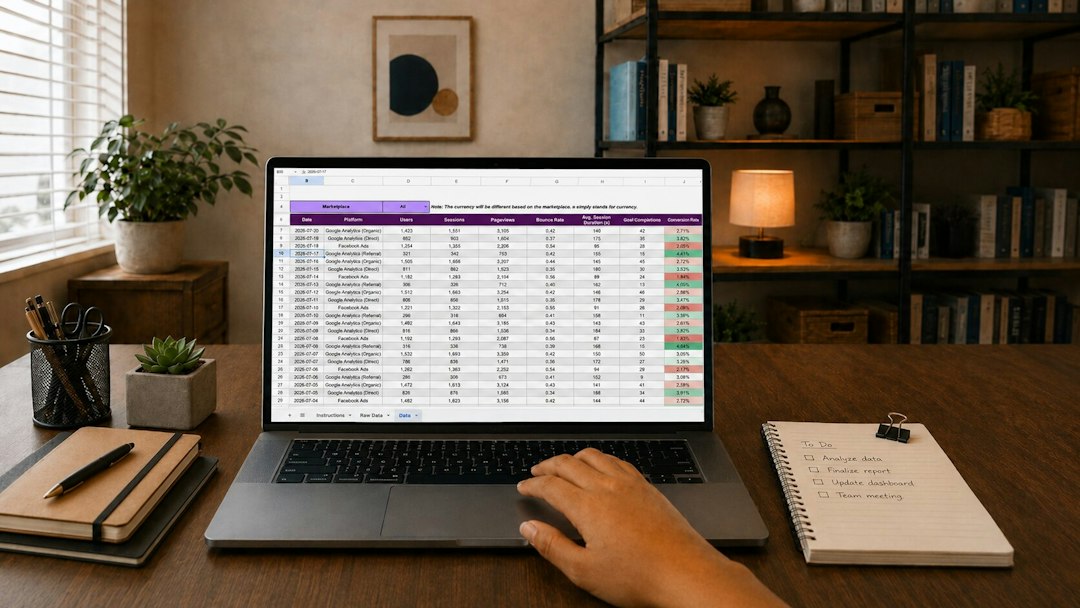
Google Sheets Dashboard: Google Sheets vs Looker Studio for Building Data Dashboards
Most teams should build quick working dashboards in Google Sheets and move polished reporting to Looker Studio when the audience grows. Google Sheets is better for hands-on analysis, edits, formulas, and fast prototypes. Looker Studio is better for cleaner visual reporting, scheduled sharing, and dashboards viewed by executives, clients, or larger teams.
TLDR: A small sales team tracking 500 monthly leads can build a useful Google Sheets dashboard in one afternoon with pivot tables, charts, and conditional formatting. If that same report goes to 12 managers and 3 clients every Monday, Looker Studio will usually save more time and reduce messy file sharing. For example, a marketing team that spends 4 hours a week copying campaign data into slides could cut that by 60% to 80% with a connected Looker Studio report. Google Sheets wins for control; Looker Studio wins for presentation.
Google Sheets Dashboard vs Looker Studio: The Simple Difference
A Google Sheets dashboard is usually built inside a spreadsheet. It pulls data from tabs, formulas, pivot tables, imports, or add-ons. The dashboard may include charts, scorecards, filters, sparklines, and color-coded tables.
Looker Studio, formerly Google Data Studio, is a dedicated reporting tool. It connects to data sources such as Google Sheets, Google Analytics, Google Ads, BigQuery, Search Console, and many partner connectors. It creates interactive dashboards that look more like business reports than spreadsheets.
The basic split is clear: Sheets is a workspace; Looker Studio is a reporting layer. One is better for building and fixing data. The other is better for sharing finished insights.
When Google Sheets Is the Better Choice
Google Sheets is the right choice when the data still needs work. Teams often need to clean names, fix dates, remove duplicates, add manual comments, or test formulas. Sheets handles that kind of messy work well.
It also suits teams that want full control. A person can click into any cell, inspect the source, and change the logic. That sounds basic, but it matters when a revenue number looks wrong five minutes before a meeting.
Google Sheets works best for:
- Small teams that need quick dashboards without a full reporting setup.
- Manual tracking, such as sales pipelines, budgets, inventory, or content calendars.
- Ad hoc analysis where formulas and one-off calculations change often.
- Prototypes before a dashboard is rebuilt in a more formal tool.
- Operations reports where users must edit the same file that shows the charts.
The annoying part is scale. A Sheets dashboard can become slow when it has many formulas, imported ranges, and charts. It drives teams a little mad when a filter takes 10 seconds to respond, then a chart refreshes with the wrong range. Permissions can also become messy when some people need edit access and others only need to view the dashboard.
When Looker Studio Is the Better Choice
Looker Studio is better when the data is already structured and the report needs to look clean. It is built for dashboards, not cell-by-cell work. Users can click date controls, filter by channel, inspect campaign performance, and view charts without touching the raw data.
For marketing, SEO, ecommerce, and executive reporting, Looker Studio often feels more professional. It can combine multiple sources into one report. A dashboard may show website traffic from Google Analytics, keyword data from Search Console, ad spend from Google Ads, and revenue data from Google Sheets.
Looker Studio works best for:
- Client reports that need branding, filters, and clean charts.
- Executive dashboards with KPIs, trends, and high-level metrics.
- Marketing performance reports across ads, analytics, and search data.
- Reusable dashboards that many users can view without editing data.
- Scheduled reporting where the same dashboard updates automatically.
The catch is that Looker Studio can feel rigid when calculations get complex. Blended data can be fussy. Custom fields may not behave like spreadsheet formulas. A simple metric that takes 20 seconds in Sheets can take several minutes in Looker Studio if the data source has limits or naming issues.

Data Cleaning and Flexibility
Google Sheets wins on flexibility. It supports formulas, scripts, manual edits, pivot tables, named ranges, dropdowns, and add-ons. An analyst can reshape data without leaving the file.
Looker Studio is weaker at data cleaning. It expects cleaner source data. It can create calculated fields and filters, but it is not ideal for fixing bad rows or restructuring messy exports. If a CSV export has mixed date formats, random blank rows, and inconsistent campaign names, Sheets is usually the better first stop.
A common setup uses both tools. Google Sheets acts as a cleaned data source. Looker Studio connects to that Sheet and turns the cleaned data into a shareable dashboard. This hybrid method is often the most practical option for teams that are not ready for a database or warehouse.
Visual Design and Presentation
Looker Studio clearly beats Google Sheets on presentation. It offers report pages, theme controls, embedded charts, scorecards, filters, date selectors, and cleaner layouts. It feels designed for viewers.
Google Sheets can still create useful visuals. Its charts, conditional formatting, slicers, and sparklines are enough for many internal dashboards. But design control is limited. Dashboard tabs can become cramped. Aligning charts takes patience. It is not rare for a chart to shift after a row is added above it, which is exactly the sort of small irritation that wastes time before a review call.
For internal use, Sheets is often fine. For board packs, client reporting, or public-facing reports, Looker Studio is usually safer.
Sharing, Permissions, and Collaboration
Google Sheets is excellent for collaboration. Multiple people can edit, comment, and review data at the same time. Version history helps recover mistakes. That makes it strong for working dashboards where the report and data entry live together.
Looker Studio is stronger for controlled viewing. Report owners can share dashboards with viewers who should not touch the source data. This reduces accidental edits. It also gives the report a cleaner user experience.
For example, a finance team may use Sheets to update monthly expenses. Managers may then view a Looker Studio dashboard that reads from that Sheet. The finance team controls the numbers. Managers get the summary without breaking formulas.
Cost and Setup Time
Both tools can be used at no extra cost for many Google users. Google Sheets is part of Google Workspace and personal Google accounts. Looker Studio is also free for core reporting, though some partner connectors and data services charge fees.
Setup time depends on the data. A basic Sheets dashboard can be created very quickly. A user can paste data, make a pivot table, insert charts, and add slicers. Looker Studio may take longer at first because it requires data source connections, field setup, chart configuration, and layout work.
Still, Looker Studio can save time later. Once a polished report is built, it can refresh data and support many viewers with less manual reporting.
Which Tool Should a Team Choose?
The best choice depends on the job:
- Choose Google Sheets when the dashboard needs editing, formulas, manual notes, or fast changes.
- Choose Looker Studio when the dashboard needs clean visuals, viewer access, filters, and recurring reporting.
- Use both when Sheets is needed for data prep and Looker Studio is needed for presentation.
For a startup, a Google Sheets dashboard may be enough for months. For an agency sending weekly reports to 20 clients, Looker Studio will usually be the better long-term choice. For an operations team tracking daily orders, Sheets may remain the better tool because the dashboard is part of the workflow.

FAQ
Is Google Sheets good for dashboards?
Yes. Google Sheets is good for simple and mid-level dashboards, especially when teams need formulas, manual edits, and quick changes. It is less ideal for polished reports with many viewers.
Is Looker Studio better than Google Sheets?
Looker Studio is better for visual reporting and sharing. Google Sheets is better for data cleaning, calculations, and hands-on analysis. Neither tool is better in every case.
Can Looker Studio connect to Google Sheets?
Yes. Looker Studio can use Google Sheets as a data source. This is one of the most common dashboard setups for small teams.
Which tool is easier for beginners?
Google Sheets is usually easier for beginners who already know spreadsheets. Looker Studio is easy for basic charts, but advanced filters, blends, and calculated fields can take more practice.
What is the best setup for most small businesses?
Most small businesses should clean and manage data in Google Sheets, then use Looker Studio for monthly or weekly reporting. This keeps the workflow simple while still producing cleaner dashboards.